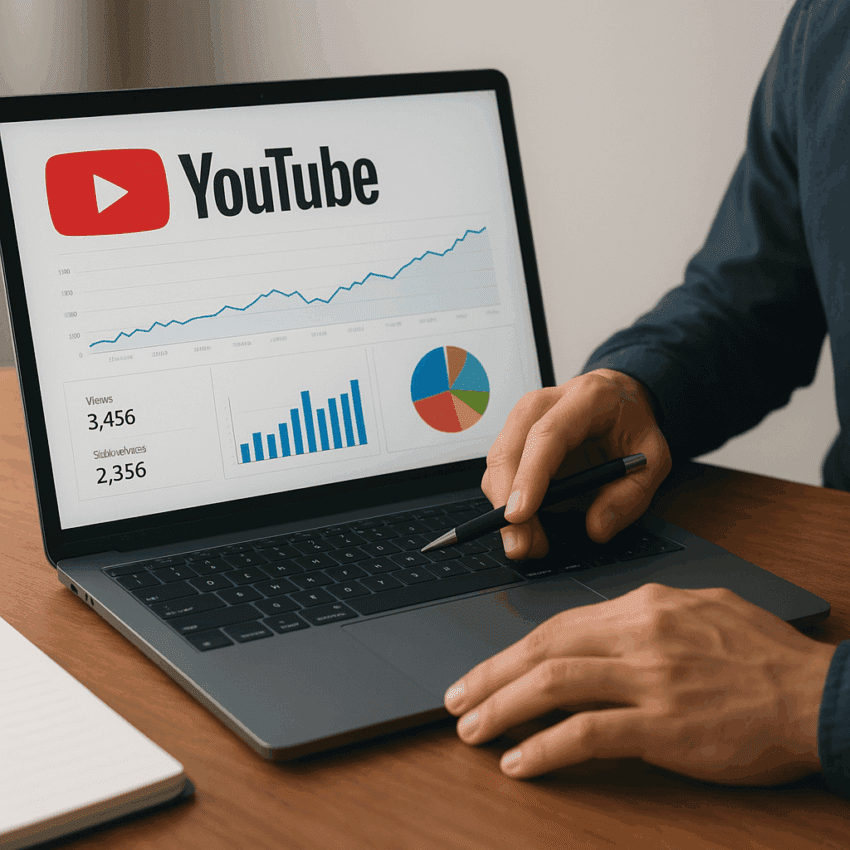
YouTube rewards creators who understand what their viewers value and use data to deliver it again and again. That is why YouTube Studio is more than a reporting panel; it is a map of human behavior that points to the fastest route to sustainable growth. In this guide you will learn how to transform numbers into narrative: what people expected from a video, where they lost interest, which traffic sources matter, and how small creative choices compound into outsized results. With just a few weekly habits rooted in Studio’s analytics, creators at every stage can win more impressions, turn curious scrollers into committed viewers, and convert viewers into subscribers, customers, or fans. Above all, you will see how to use data without losing your creative edge—because the best analytics practice is the one that protects your unique voice while expanding your audience.
Why YouTube Analytics Is the Fastest Lever
YouTube’s recommendation system is built to maximize viewer satisfaction and long-term use, not just one-off views. The algorithm looks at signals such as click-through rate (CTR), average view duration, audience retention, likes, comments, shares, watch history, and how often people return to a channel. YouTube has reported that people watch over one billion hours of video per day, and the platform has more than two billion logged-in monthly users—an opportunity so large that small percentage gains translate into huge absolute results. Analytics show you exactly where those percentage gains live.
Three reasons analytics move you faster than guesswork:
- Precision: Studio tools such as “Key moments for audience retention” and the Research tab surface exact moments and topics to improve.
- Speed: Real-time analytics reveal early performance, allowing quick title/thumbnail updates while momentum is building.
- Compounding: Improving retention by even 5–10% often increases session time and suggested traffic, feeding a feedback loop of discovery.
The Metrics That Matter (And How to Read Them)
Impressions and Click-Through Rate
Impressions measure how often thumbnails are shown across YouTube surfaces. Click-through rate (CTR) is the percentage of impressions that turned into views. YouTube has stated that CTR varies widely by niche and surface, but many channels see a typical range between 2% and 10%. Browse and Home feeds often have more impressions and lower CTR; Search and Suggested might have higher intent and different CTR patterns. The key is not to chase a universal benchmark but to trend your own performance by surface and content type.
- Segment CTR by traffic source: Compare Search vs. Browse vs. Suggested. A low CTR in Browse might be offset by massive impressions if retention is strong.
- Monitor changes over time: If CTR drops after 24 hours while impressions rise, your title/thumbnail may be mismatched with the audience that YouTube is now testing.
- Contextualize with watch time: A slightly lower CTR with much higher watch time can deliver more recommendations than a high CTR with weak engagement.
Views, Unique Viewers, and Frequency
Views show consumption; unique viewers estimate reach; average views per viewer shows frequency. Frequency is a good proxy for loyalty. Watch this metric alongside “Returning viewers” to see if your content encourages binging and repeat visits.
Audience Retention and Key Moments
Audience retention reveals how well your video holds attention. Average view duration (AVD) and average percentage viewed (APV) are the high-level indicators; “Key moments for audience retention” exposes the details: the intro hook, spikes for replays or chapters, gradual vs. sharp declines, and the exact timestamp where drop-offs happen. Relative audience retention (if available) compares your curve to similar videos on YouTube, offering a reality check beyond your channel.
- Intro test: If you lose 30–50% in the first 30 seconds, test a faster hook, remove long intros, or preview the payoff earlier.
- Drop-off diagnosis: Identify 2–3 recurring timestamps where viewers leave (e.g., sponsor reads, long tangents). Adjust structure or pacing in the next upload.
- End optimization: If viewers exit before your end screen, move your final CTA earlier (e.g., at 85–90% of runtime) and make it contextual to the video’s promise.
Traffic Sources and Surfacing
Traffic sources tell you where discovery is happening: Browse features (Home and Subscriptions feeds), Suggested videos, YouTube Search, External, Playlists, Notifications, and Shorts feed. Early in a video’s life, Browse and Notifications may dominate; over time, Suggested and Search can provide durable discovery. Use source labels to tailor improvements: better metadata and chapters for Search, tighter content adjacency and series packaging for Suggested, strong hooks for Browse.
New vs. Returning Viewers
This panel helps balance acquisition and loyalty. New viewers reveal the reach of your topics and packaging; returning viewers signal satisfaction and brand affinity. A common growth pattern is to first push acquisition with broadly appealing content, then deliberately program for returning viewers to deepen loyalty (series, recurring formats, community posts).
Subscribers and Notifications
Subscribers are not guaranteed viewers. Look at subscriber bell settings (All, Personalized, None) and notification click-through. Segment performance for subscribers vs. non-subscribers to understand whether packaging speaks to a broader audience or mainly to your core.
Revenue: RPM, CPM, and Mix Effects
If you’re monetized, RPM (revenue per 1000 views) shows money per view; CPM shows advertiser bids per 1000 monetized playbacks. RPM is influenced by geography, seasonality, ad formats, and watch time (longer videos can show mid-rolls). Diversify with memberships, affiliates, sponsorships, and product sales to stabilize income through demand cycles while using analytics to map high-value topics that drive strong RPM and deep engagement—key for long-term monetization.
Shorts, Long-form, and Live Metrics
Shorts feed delivers massive impressions quickly; retention is measured differently (looping and swipes). For Shorts, focus on “Viewed vs. swiped” behavior, early second-by-second retention, and how often Shorts viewers convert to long-form sessions (track via content funnels and end slates that point to a long video or playlist). For live streams, concurrent viewers, chat rate, and replay retention are crucial signals. Treat each format’s analytics in its own context, then connect them with intentional funneling.
Turning Insights Into Action: A Practical Workflow
Data only matters if it changes what you do. Turn Studio into a weekly operating system with this loop:
- Define the goal: e.g., raise Browse CTR from 4% to 6% or increase average view duration by 20 seconds.
- Form a hypothesis: e.g., “Lead with outcome before process” or “Add a supercut cold open to compress context.”
- Segment the data: Compare top vs. bottom quartile videos by retention; map common traits in titles, thumbnails, pacing, or topics.
- Run a focused test: Use YouTube’s Experiments (when available) to A/B test titles or thumbnails; otherwise, swap manually during the first 48 hours.
- Measure and decide: Check impact on CTR, watch time, and suggested traffic. Choose the winner and document the learning.
- Systematize: Codify successful patterns into checklists so your process gets faster and more consistent with each upload.
Research, Content Gaps, and Search Intent
The Research tab in YouTube Studio surfaces what your viewers and similar audiences are searching for. Look for “content gaps” where search demand is high but results are low quality, too long, or missing angles. Map keywords to intent: tutorials (how-to), comparisons (vs.), explainers (what/why), and inspiration (ideas/best). Use chapters and clear titling to own rich snippets and “key moments” in Search. When writing metadata, favor natural language and viewer value over keyword stuffing to maintain click trust and session depth. Keep a living backlog of validated ideas ranked by demand, competitive density, and creator fit.
Titles and Thumbnails: Systematic CTR Optimization
Packaging is a promise, not just decoration. Great thumbnails and titles communicate a single clear idea, create curiosity without deception, and are legible on mobile. A good title-thumbnail pair answers: What is it? Why now? Why you?
- Signal the payoff: Lead with outcome or tension (“I rebuilt X to beat Y,” “The 10-minute method that…”).
- Design for the first glance: High contrast, tight cropping on faces or objects, 3–5 words of overlay text max, avoid cluttered backgrounds.
- Match title and thumbnail: If the title is abstract, the thumbnail should be concrete (or vice versa) so they complement rather than repeat.
- Mobile-first: Test readability at 10% scale; ensure faces/objects aren’t covered by timestamps.
- Ethical curiosity: Avoid clickbait. Misleading packaging may spike CTR but crushes watch time and trust, hurting long-term distribution.
Use Experiments to A/B test titles or thumbnails where available. If not, rotate variants within the first 24–48 hours and watch CTR by surface. Document every hypothesis you test so small lessons aggregate into a durable style guide. Embrace controlled experimentation as a habit, not a one-off task.
Retention Engineering: Structuring Videos People Finish
YouTube values sessions, not just starts. To earn more browse and suggested traffic, architect videos to maintain interest across the full arc.
- Cold open and hook: Put the destination up front (“Here’s the transformation… now let’s build it”). Fast visual proof earns patience for context.
- Promise-setup-payoff loop: Shorten the distance between each promise and its payoff. Use pattern interrupts every 15–45 seconds (angle changes, graphics, humor).
- Remove friction ruthlessly: Cut redundancies and meandering intros. Pace up sections with consistent drop-offs in the retention curve.
- Chapter strategy: Add chapters with searchable labels; it helps viewer control and can improve Search visibility via marked “key moments.”
- Pre-sell the next video: Tease the sequel mid-video and tie your end screen directly to that promise so the handoff feels inevitable.
Shorts, Long-form, and Live: One Funnel, Multiple Doors
Shorts are awareness engines; long-form builds relationship; live drives community and revenue. Connect them intentionally:
- Shorts to long-form: End a Short with a narrative cliff or “See the full build/results in the channel”—link via pinned comment and end slates where applicable.
- Long-form to live: Use end screens to promote upcoming streams; recap highlights in Shorts to keep momentum alive.
- Format analytics: Track conversion rates between formats. A 2–5% click to long-form from a high-volume Short can transform a channel’s trajectory.
Audience Development: Timing, Cadence, and Community
Studio’s “When your viewers are on YouTube” chart suggests optimal publish times. Pair that with geography and device breakdowns to schedule releases when key segments are active. Consistency compounds in two ways: the algorithm learns who likes you, and humans build a habit around your uploads. Treat replies, community posts, and polls as programming assets that maintain session momentum between videos and make viewers feel heard.
- Publish windows: Test 2–3 slots for 4–6 weeks each; pick the one with the best 1-hour and 24-hour performance.
- Cadence: Balance quality with reliability. A weekly series often outperforms sporadic bursts because it trains both viewers and the system.
- Feedback loop: Ask a question in-video; continue it in a community post; use the responses to shape the next upload.
Over time, operational consistency is a creative multiplier. It’s easier to iterate when the next upload is already on the calendar and the team knows the checklist.
Suggested Traffic and the Power of Adjacency
Suggested videos are the river that carries channels from stable to explosive discovery. Improve your odds by increasing topical adjacency and session continuation:
- Series packaging: Similar titles and thumbnails across a series help YouTube connect related videos. Use consistent naming patterns and visual motifs.
- Playlists that act like shows: Order episodes intentionally and enable “set as series” where relevant; link playlists on end screens instead of single videos when appropriate.
- Collaboration routing: Collab with creators your audience already watches. Watch your “Other channels your audience watches” panel for targets.
Case-Study Math: Turning Small Wins Into Big Outcomes
Consider a channel averaging 10,000 impressions per new video on Home with a 4% CTR and 4 minutes AVD (400 views × 4 minutes = 1,600 minutes watch time in early testing). If you lift CTR to 6% via better packaging, that’s 600 views; if you also raise AVD to 5 minutes through tighter hooks, that’s 3,000 minutes—nearly 2× watch time from small optimizations. Because early watch time fuels more recommendations, the second-order effect can be even larger as Browse impressions expand. The lesson: improve CTR and AVD together; the product is what the algorithm cares about.
Advanced Diagnostics: Cohorts, Segments, and External Traffic
Not all views are equal. Segment cohorts (e.g., new vs. returning, mobile vs. TV, US vs. international) to spot content-market fit. Long videos may perform better on TV where viewers lean back; tutorials might excel on mobile. External traffic (newsletters, social posts) can kickstart velocity, but old-school “link dumping” can hurt if the external audience clicks but doesn’t watch. Instead, pre-qualify externally with context: show the payoff image, specify runtime, and ask for feedback to attract the right clickers.
Building a Creator Scorecard
Turn insights into a weekly scorecard that tracks lagging and leading indicators:
- Leading: Thumbnail test results, first-30s retention, 1-hour Browse CTR, comments per 1000 views.
- Lagging: 7-day and 28-day views, total watch time, new subscribers, RPM.
- Operational: Upload cadence, time-to-first-experiment, script revision count, edit review notes closed.
Set quarterly objectives (e.g., increase average percentage viewed from 43% to 50%) and attach key results (run 12 A/B thumbnail tests; reduce first-30s drop-off by 10%). Make the scorecard visible to everyone involved so data literacy becomes cultural.
Common Pitfalls (And How to Avoid Them)
- Optimizing for CTR alone: Clicks without satisfaction signal are short-lived. Pair CTR with retention and session length.
- Imitating without understanding fit: What works for one niche may fail in another. Always validate on your own channel data.
- Overstuffed titles and tags: Metadata should clarify, not clutter. Aim for one clear promise per video.
- Ignoring silent viewers: Many watch with sound off for the first seconds. Use captions, on-screen text, and visual storytelling.
- Too many calls to action: One focused CTA beats five scattered asks. Align it with the video’s core value.
Tooling and Light Automation
While Studio is the core, a few lightweight additions can help:
- Sheets + API exports for weekly dashboards and cohort tracking.
- Design templates for titles and thumbnails to speed testing.
- Comment mining tools to cluster recurring questions—often the fastest source of validated topics.
A 90-Day Analytics-Driven Action Plan
- Week 1–2: Audit top/bottom 10 videos by AVD and CTR; extract 5 packaging rules and 5 editing rules from winners.
- Week 3–6: Publish 4–6 videos using the new rules. Run at least one A/B test per upload. Track first-30s retention and 24-hour CTR by surface.
- Week 7–8: Deep-dive on Research tab; produce 2–3 content-gap videos with chapters and strong how-to titling.
- Week 9–10: Build a bingeable playlist series; standardize naming and end-screen routing.
- Week 11–12: Review cohort performance (device, geography, new vs. returning). Adjust publish times and hooks for the dominant cohort.
Creative Integrity Meets Measurable Impact
Analytics do not replace taste; they refine it. Use numbers to protect the viewer’s time and to support your instincts with evidence. When in doubt, ask the questions Studio helps you answer: Did the packaging set the right expectation? Did the first 30 seconds deliver unmistakable value? Where did attention waver and why? What can I do in the next upload—title, thumbnail, structure, pacing—to improve that moment? Over time, those small decisions form a signature style that people recognize and return to. Keep your eye on the flywheel: better packaging boosts CTR, stronger intros improve AVD, thoughtful sequencing increases suggested traffic, and consistent execution multiplies results.
Quick Reference: From Data to Decision
- If Browse impressions are high but CTR is low: Refresh title/thumbnail; sharpen the promise; test contrast and composition.
- If CTR is healthy but AVD is weak: Rework the cold open; cut filler; preview the payoff earlier; add pattern interrupts.
- If Search is strong but Suggested is weak: Build series and playlists; align topics visually; reference related videos mid-roll.
- If returning viewers are flat: Launch a recurring format; schedule community posts; ask for story submissions.
- If RPM is volatile: Diversify revenue; emphasize evergreen topics with stable advertiser demand; lengthen videos where it serves the story.
Keyword Strategy Without the Crutch
Think like a viewer first, an SEO specialist second. Titles should reflect how a human would search or decide to click. Use primary and secondary keywords naturally in the title, description, and chapters, but keep the click promise crystal clear. Chapters can rank as distinct results for “key moments,” capturing micro-intent queries. Thumbnails should visualize the outcome or obstacle related to the primary keyword for immediate relevance in crowded feeds.
Human Signals the Algorithm Loves
The recommendation system is a mirror of human satisfaction. Here are the durable signals that shape discovery:
- Clear outcomes: People prefer videos that quickly show “what I will get.”
- Reduced uncertainty: Titles and thumbnails that minimize cognitive load increase confident clicks.
- Rhythmic pacing: Varied cadence and structure keep the brain engaged.
- Continuity: Seamless handoffs to the next video extend sessions, a core signal for distribution.
Use these principles to guide creative choices, then validate with Studio. Keep your channel’s North Star visible: Does each upload deepen trust and push the flywheel a little faster?
From Insight to Identity
Ultimately, analytics are instruments, not instructions. Let them sharpen your story, tighten your edits, and prove your hypotheses. Keep a running Creator Playbook—your personal rulebook born from your data. Inside it, highlight your most powerful words and practices: growth, analytics, audience, CTR, retention, thumbnails, experimentation, consistency, keywords, monetization. Revisit the playbook every quarter; retire rules that stop working; add new ones that do. The outcome is a channel that learns as fast as you create—and a creator who creates as smart as you learn.